Workshop: Introduction to JSON
Translating text into a structured data exchange format

https://tinyurl.com/jsonworkshop
Instructor: Chris Fulton

Agenda
- First Hour
- Explaining, Interpreting + Accessing JSON data
- Practice Activity
- Retrieving data from JSON data structure
- [15 min. break]
- Second Hour
- Requesting data from a RESTful API
- Making a Http Request to RESTful API call Activity
- Understanding and Visualizing API data using a AppSmith
- Q and A
Learning Objectives
- You will learn how to:
- Convert text into JSON format
- Retrieve specific data stored in JSON format
- Interpret JSON data
- Execute an HTTP request to interact with a RESTful API
- Organize JSON data for meaningful insights through visualization using Low Code Environment
- Skills:
- JSON, RESTful Architecture, Client/Service Architecture, Data Visualization
What is JSON?
JSON Use Cases
a lightweight text-based open standard designed for human-readable data exchange
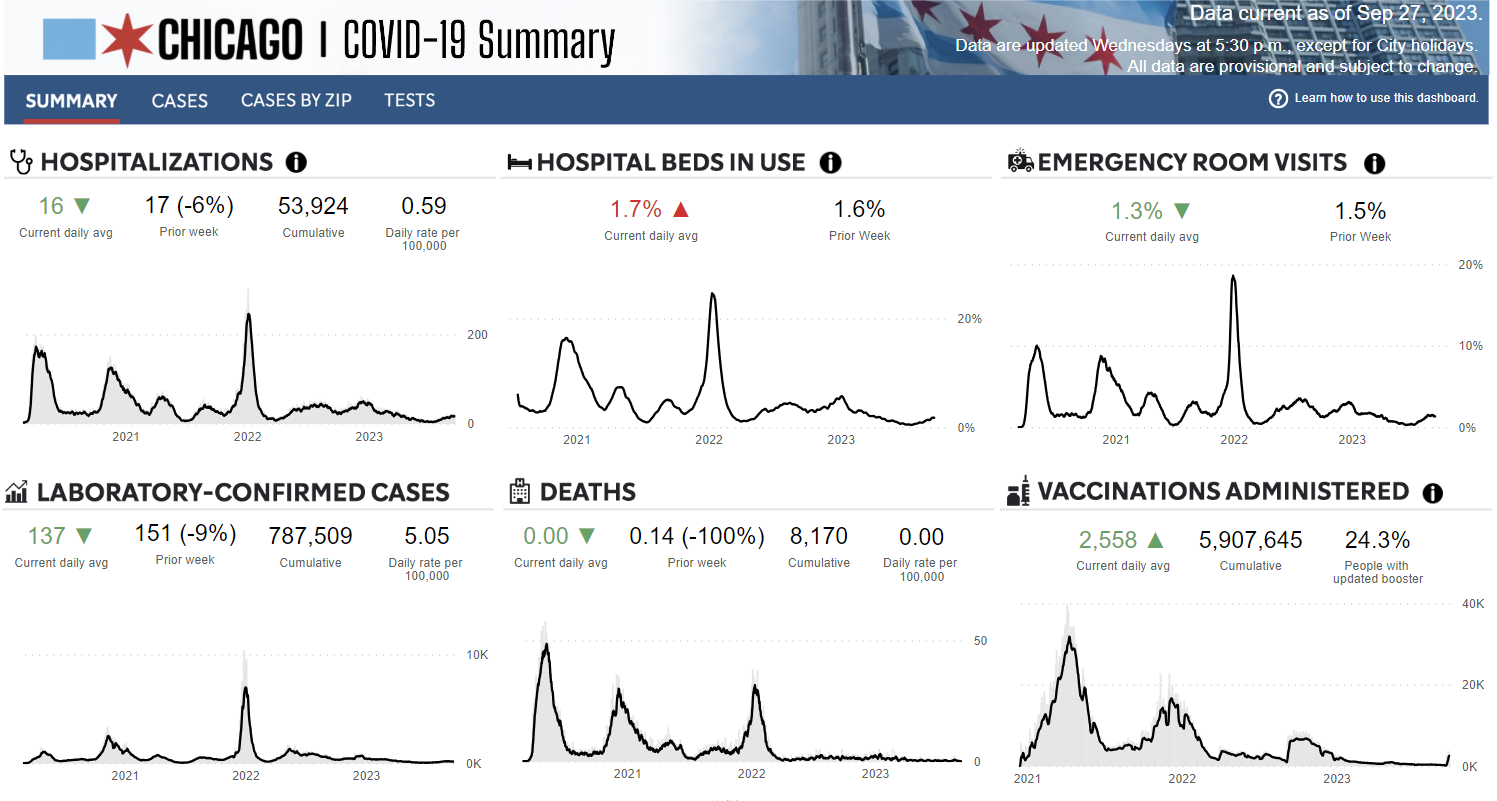
Databases | Configuration | REST API
JSON Rules and Data Types
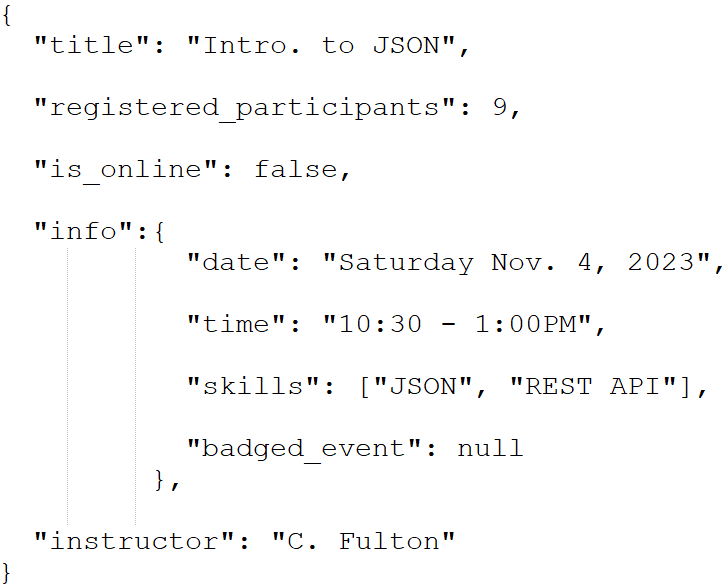
Key/value -> JSON consist of stacked key/value pairs. Each key/value pair ends with a comma with the exception of the last key/value pair.
How many key/value pairs do you see?
Keys -> All keys should have quotations
No spaces in keys + good practice to make keys lowercase
Nesting -> key/value pairs can be nested
Data types -> certain syntax needed for values based on the data
JSON Rules and Data Types
String
"title": "Intro. to JSON"Number
"participants": 12Null
"badged_event": nullBoolean
"is_online": trueArray
"skills": ["JSON", "REST API"]Object
     "info":{

								     "time": "9AM",

								     "hours": 3,

								     "isOK": false

								    }
It is common to see an array of objects. Multiple instances of grouped data with same keys.
Think -> rows in an excel sheet
Practice Activity

Retrieving JSON
//Write pseudocode here
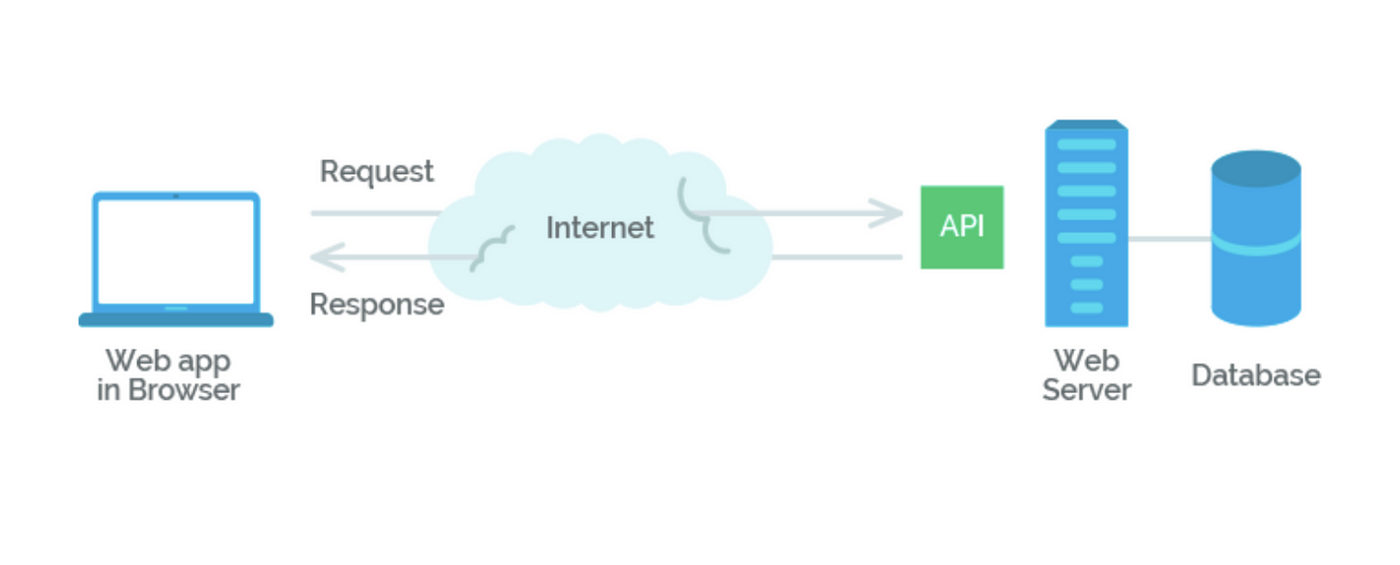
What is REST API?
REST Principles or Constraints
Source: https://medium.com/geekculture/rest-architectural-constraints-495a50ae0651
Client - Server Arch.
Separates Client and Server - Client makes request
Uniform Interface
Consistent way of Interaction - HTTP verbs
Stateless
No information from previous request
Cachable
Response determines if cachable or not. Determines clients ability to reuse data
Layered System Arch.
Use of Intermidiary servers(proxies, load balancers, etc..)
Representation
Various Formats - various formats(HTML, JSON, XML, etc..)
Web Services
Software systems designed to allow interaction between different applications or systems over a network, typically the internet. They provide a standardized way for software components to communicate and exchange data, enabling the integration of disparate systems and platforms
A few API's
- NASA API [RESTful API]
- Open Food Facts [RESTful API]
- Weather Bit API [RESTful API]
- Google Maps API [Geolocaton API]
- YouTube API [Video API]
- Spotify API [Media API]
- Stripe API [Payment API]
Web Service Tools
Considerations
- Obtaining an API Key
- Paid and Free Services
- Request Limits
- Adhering to License Requirements and Limitations
Making a Request
URI Query syntax | Http verbs | Query Paramters | Authorization | Header Paramters
https://data.cityofchicago.org/resource/d6ui-3yap.json
GET | POST | PUT | DELETE
Practice Activity
Follow the steps to make a successful request to the college scorecard API
Step 1
Navigate to https://api.data.gov/signup/ to sign up for an API Key. Check your email and copy the api key. You will need to provide the API Key as a key/value parameter as part of your request.
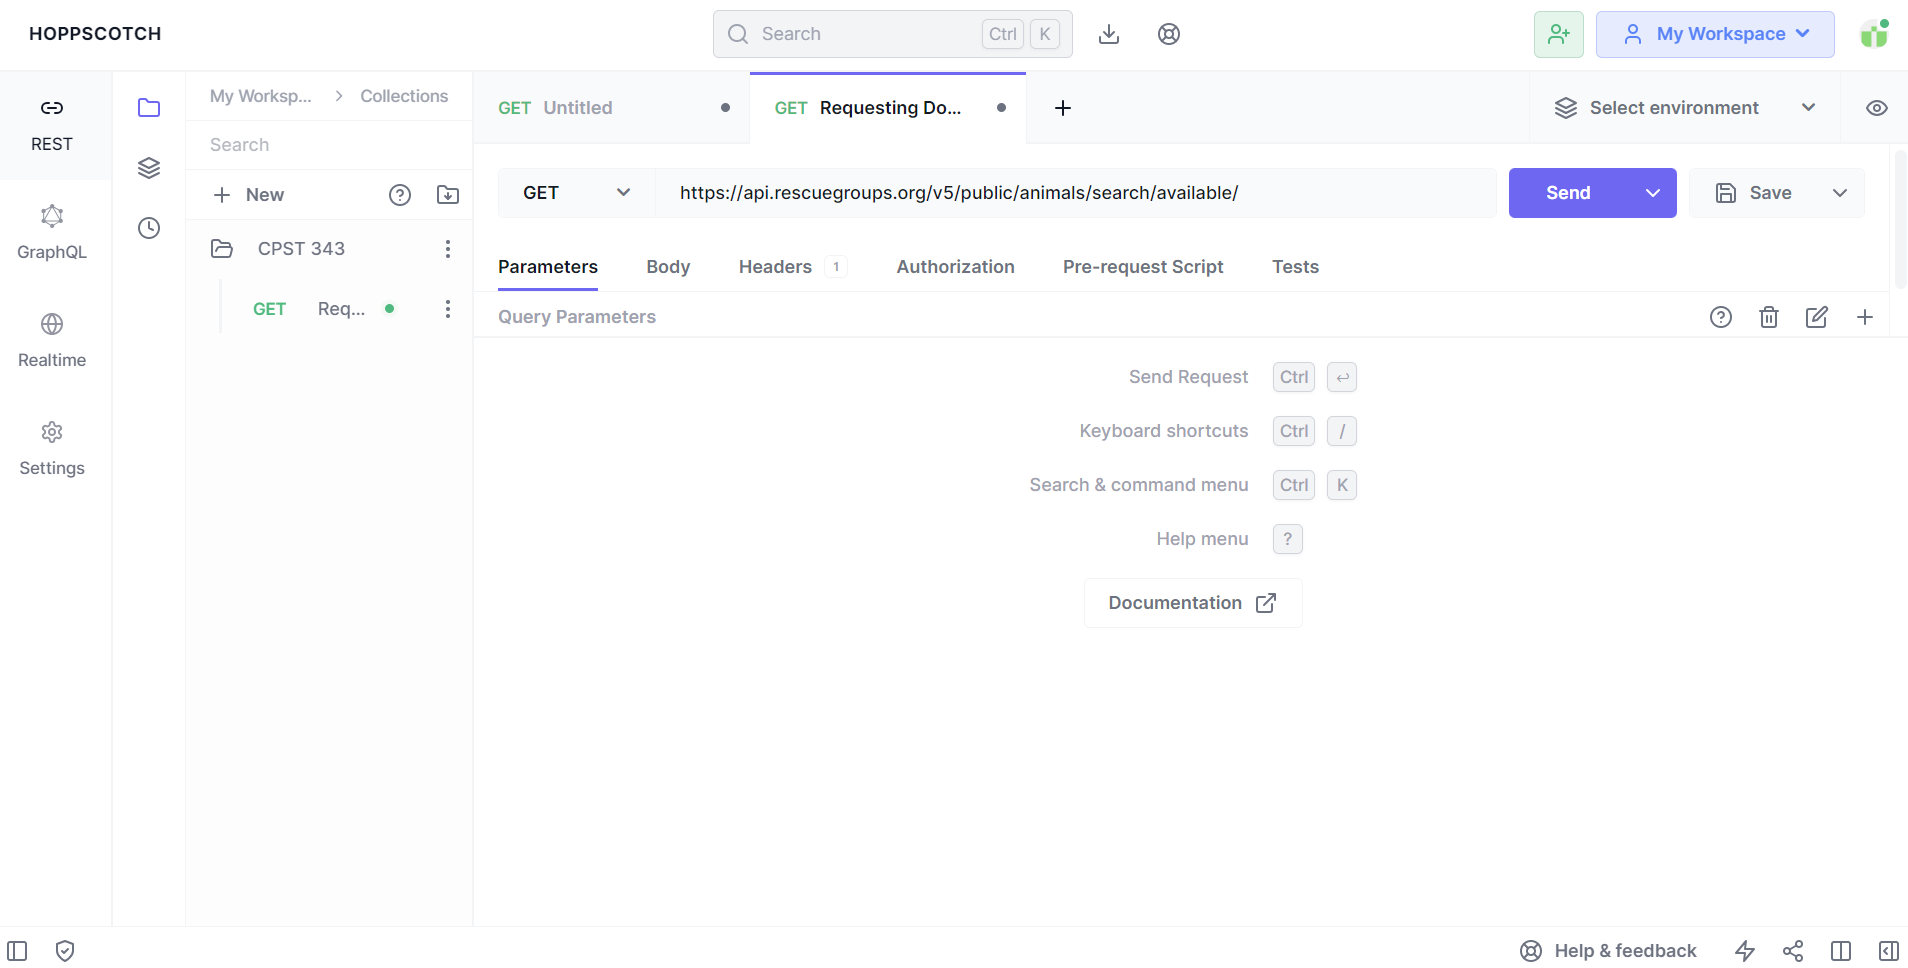
Step 2
Open a new browser and navigate to hoppscotch.io and follow the steps on the next slide.
Step 3
Review and Interpret the data by return from request. Navigating to the next two slides select an option for the two multiple choice questions.
Practice Activity Steps
1. Creating a Collection of Queries -> Click the new button and name the collection CollegeScoreCard API queries
2. Create a Request Instance -> Select the three stacked dots symbol next to the folder and select 'New Request'. Name the request "General School Query". A new tab will display with the request name you entered. Underneath the tab, Make sure 'GET' is preset as the dropdown option. Remove the URL 'https://echo.hoppscotch.io' and add the URL below.
https://api.data.gov/ed/collegescorecard/v1/schools.json
3. Adding API Key for Authorization -> Your API key can be added as either query parameters or by using the 'Authorization' tab. Select the Parameters tab, and enter 'api_key' for the key and enter the key provided to you via email as the value. Press the 'SAVE' button and then press the 'SEND' button.
4. Narrowing Search -> Using GitHub Documentation found at this link. Create a new request under your CollegeScoreCard API queries that limits the returned results to schools in with the name 'Loyola'. Copy the results and view the structure in https://jsonformatter.org/json-viewer
5. Complete Multiple Choice question -> Anwser multiple choice question on the following slide.
College Scorecard API Question #1
How many schools are returned from the request:
Visualizing JSON Data
Low-code/No-Code Dev. Environments + BI Tools


Practice Activity
Follow the steps to create an AppSmith App that visualize the city of Chicago estimated revenue sources
Step 1
Sign into your AppSmith account and skip the tutorial when you first log in.
Step 2
Select from one the REST API's above and follow the steps on the next slide.
Step 3
If you finish early, look around and see if you can assist someone else.
Process and Steps
1. Select Datasource option -> Click on the new datasource plus sign in left column and select 'REST API'
2. Configure API Request -> Rename the datasource to 'cityofchicago_api'
Make sure the http verb is set to 'GET' and add the URI below:
https://data.cityofchicago.org/resource/at79-usba.json
3. Add Table Widget and connect datasource -> Select the widgets tab and drag a table on canvas area. Click the 'Connect data' button and select cityofchicago_api under Connect to query
4. Add Another Widget: JSON Form -> Select the widgets tab and search for JSON form and drag to canvas area. Select 'Generate Form' and connect to table widget.
5. Add Another Widget: Chart -> Select the widgets tab and search for Chart and drag to canvas. Using the properties panel to the left, select 'Pie Chart for Chart type.
6. Add Chart Datasource -> Using the properties panel to the left, scroll down to the series data and enter the javascript code below.
{{cityofchicago_api.data.map(p => ({x:p.revenue_source, y: p.estimated_revenue}))}}
7. Adjust Chart Properties -> Using the Chart properties panel, adjust 'Series title' to 'Estimated Revenue Sources'. Adjust 'Title' to 'City of Chicago Estimated Revenue'
Data Type Activity
Which revenue source is expected to generate the second largest income for the city?